Data Collection
IN THE FIELD:
Field sampling and measurements occurred in July 2020. Five sites were selected in Jasper National Park using information from previous research as well as the advice of Parks Canada (Figure 5). Healthy trees were defined as trees with no visible symptoms of any insect or pathogen attacks (Figure 7).

Figure 5. Map of research sites in Jasper National Park.

Figure 6. Image of one of the sites in Jasper National Park.
|

Figure 7. Pitch tube on lodgepole pine tree from a mountain pine beetle attack.
|
Healthy lodgepole pine trees with a mean DBH of 20.0 cm were chosen. Phloem tissues were sampled from live lodgepole pine trees using a leather hollow punch of 1.9 cm diameter (Figure 8). Two samples were taken from all four cardinal directions at 1.3 m above ground. The eight phloem samples were wrapped together in labelled aluminum foil and immediately dipped into liquid nitrogen. The samples were stored on dry ice for transport to the laboratory where they were stored at -40 °C until chemical analysis. One 5 mm increment core and one 12 mm increment core were taken 1 m above ground level from the north and south sides of the tree, respectively (Figure 9). Cores were placed in straws and labelled. All tools were kept sterile using ethanol.
The sampling date and coordinates were recorded on a data sheet and GPS unit. Site slope degree and tree height were measured with a clinometer and surveyor’s tape. Site aspect (in degrees north) was determined with a compass. Stand density was determined using an angle gauge with a basal area factor of 20 in a variable radius plot.
The sampling date and coordinates were recorded on a data sheet and GPS unit. Site slope degree and tree height were measured with a clinometer and surveyor’s tape. Site aspect (in degrees north) was determined with a compass. Stand density was determined using an angle gauge with a basal area factor of 20 in a variable radius plot.

Figure 8. Image of where phloem sample was taken from lodgepole pine using leather hollow punch.
|

Figure 9. Image of where increment core was taken from lodgepole pine.
|
IN THE LAB - RESIN DUCTS:
Core samples were glued to wooden mounts and dried for two weeks at room temperature. Samples were than sanded with belt and hand sanders using progressively finer sandpaper. Next, samples were scanned at 1200 dpi to create high-resolution digital images. Annual growth (mm) was measured from bark to pith using ImageJ on all samples (Zhao et al. 2019). Using a master chronology that was previously developed in lab, calendar years were assigned to each ring. Further, specific ring characteristics were compared to verify calendar year, such as width ratio between early and late wood per ring and the contrast between early and late woods (Zhao and Erbilgin 2019, Zhao et al. 2019).
All resin ducts were examined using ImageJ within a fixed sampling width of 10 mm (Figure 11; Schneider et al. 2012, Zhao et al. 2019). To analyze resin ducts, resin duct production (number of resin ducts per 10 mm width per year on an increment core or wedge [no. yr-1]), resin duct size (mean size of resin ducts per 10 mm width per year on an increment core or wedge [mm2 yr-1]), total resin duct area (sum of resin duct area per 10 mm width per year on an increment core or wedge [mm2 yr-1]), resin duct density (total number of resin ducts per year divided by the ring area (10 mm * ring width) for a given year [no. mm2 yr-1] and relative resin duct area (percent area occupied by resin ducts per year within the ring area for a given year [% yr-1]) was calculated for each core or wedge (Kane and Kolb 2010, Zhao and Erbilgin 2019, Zhao et al. 2019). Ring width (mm yr-1) and basal area increment (BAI, [mm2 yr-1]) were used to represent tree radial growth. Tree radii and ring width data were used to calculate BAI assuming that tree rings are concentric circles (Kane and Kolb 2010, Zhao and Erbilgin 2019). Tree radii was calculated by dividing tree DBH by two.
All resin ducts were examined using ImageJ within a fixed sampling width of 10 mm (Figure 11; Schneider et al. 2012, Zhao et al. 2019). To analyze resin ducts, resin duct production (number of resin ducts per 10 mm width per year on an increment core or wedge [no. yr-1]), resin duct size (mean size of resin ducts per 10 mm width per year on an increment core or wedge [mm2 yr-1]), total resin duct area (sum of resin duct area per 10 mm width per year on an increment core or wedge [mm2 yr-1]), resin duct density (total number of resin ducts per year divided by the ring area (10 mm * ring width) for a given year [no. mm2 yr-1] and relative resin duct area (percent area occupied by resin ducts per year within the ring area for a given year [% yr-1]) was calculated for each core or wedge (Kane and Kolb 2010, Zhao and Erbilgin 2019, Zhao et al. 2019). Ring width (mm yr-1) and basal area increment (BAI, [mm2 yr-1]) were used to represent tree radial growth. Tree radii and ring width data were used to calculate BAI assuming that tree rings are concentric circles (Kane and Kolb 2010, Zhao and Erbilgin 2019). Tree radii was calculated by dividing tree DBH by two.
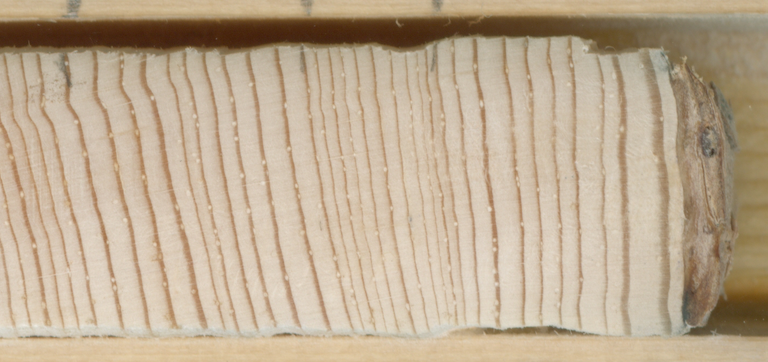
Figure 10. Image of 5 mm core used to calculate age.
|

Figure 11. Image of 12 mm core used for resin duct measurements. Black square on image shows standardized area used to measure resin duct characteristics in ImageJ. Note that small white dots in annual ring are the resin ducts.
|
IN THE LAB - CHEMICAL DEFENCES (Monoterpenes, Diterpenes and Non-structural Carbohydrates)
Any residual bark was removed from the samples. The thickness of the phloem was measured using digital calipers in the lab (to the nearest 0.01 mm). Phloem samples were combined for each tree and ground in liquid nitrogen with a mini bead beater at 2200 rpm for three 20 sec intervals. This was repeated four times per sample. All equipment was cleaned using 90% ethanol between grinding of each sample. After grinding, samples were divided for monoterpene (100 mg), diterpene (30 mg) and NSC (30 mg) analyses.
Summary of Monoterpene Analysis:
Monoterpene analysis was modified from the method used in Cale et al. (2019a). Samples were mixed with hexane and pentadecane for an internal standard and then analyzed with a GC-MS (GC 7890A, MS 5975C; Agilent Tech., Santa Clara, CA, USA) fitted with a HP-Chiral-20B column (30 m x 0.25 mm ID x 0.25 µm film). Chemical compounds were identified by comparing the mass spectra and retention times to those of known standardized chemicals. Compounds were quantified as µg per mg of dry phloem tissue.
Summary of Diterpene Analysis:
Analysis followed the protocol listed in Cale et al. (2019b). Diterpenes were extracted from 30 mg of lyophilized ground tissue in 1 mL of menthol. Diterpene acid extractions were analyzed using an ultra-performance liquid chromatograph (UHPLC, 1290 Infinity; Agilent Tech., Santa Clara, CA, USA), fitted with an InfinityLab Poroshell 120 EC-C18 column (2.1 x 150 mm 1.9 µm; Agilent Tech., Santa Clara, CA, USA) and a diode array detector (UV/Vis, 1290 DAD; Agilent Tech., Santa Clara, CA, USA). Diterpene resin acids were quantified using wavelengths of 240, 268 and 282 nm as adapted from a multiwavelength detection approach from Kersten et al. (2006). Standard curves calculated from dilutions prepared of pimaric acid (80%), abietic acid (95%), dehydroabietic acid (99%), isopimaric acid (99%), levopimaric acid (95%), neoabietic acid (99%), palustric acid (92%) and sandarocopimaric acid (90%) were used to quantify diterpene acids. Pimaric and isopimaric acids were listed together as due to coelution with abietic acid, they cannot be quantified.
Summary of Non-structural Carbohydrates (Soluble Sugars and Starches) Analysis:
Analysis followed the protocol listed in Cale et al. (2019b). Fructose and sucrose were extracted from 30 mg of the lyophilized and ground phloem tissue. Fructose and sucrose were analyzed with the UHPLC system that is fitted with an Infinity Lab Poroshell 120 HILIC-Z column (2.1 x 100 mm 2.7 µm; Agilent Tech., Santa Clara, CA, USA) as well as with an Evaporative Light Scattering Detector (ELSD, 1290 ELSD II; Agilent Tech., Santa Clara, CA, USA). For the glucose and starch extractions, 25 mg of the lyophilized ground phloem tissue was used. A Synergy Microplate Reader H1 (BioTek, Winooski, VT, USA) was used to analyze glucose and starch concentrations.
