Data Tables
The following images are selections from my data tables.
Resin Duct Data

Figure 12. Image of part of resin duct data table.
Annual Growth Data
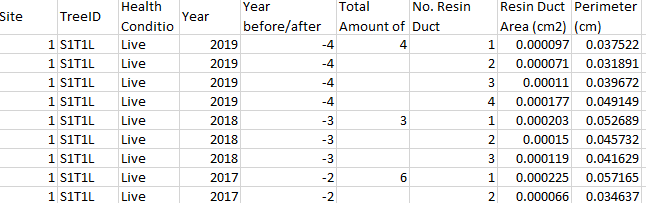
Figure 13. Image of part of annual growth data table.
Monoterpene Data

Figure 14. Image of part of monoterpene data table. Reported in ng/mg. This was recalculated as ug/mg in R software.
Diterpene Data
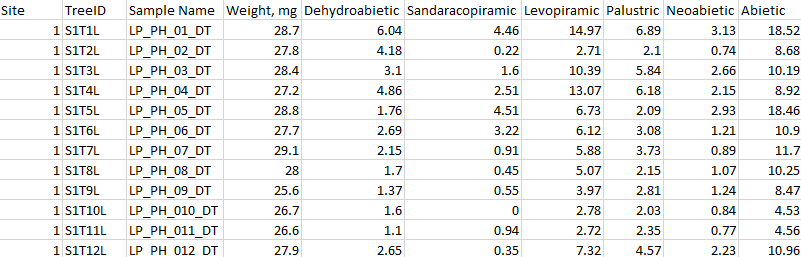
Figure 15. Image of part of diterpene data table. Reported in ug/mg.
Non-Structural Carbohydrates Data
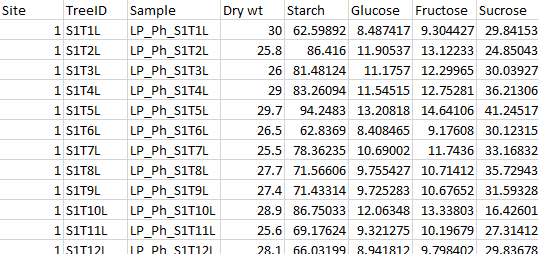
Figure 16. Image of non-structural carbohydrates data table. Reported in ug/mg.
Variables
The aim of my research is to determine whether there is a relationship between anatomical defences and resin-based chemical defences, as such I cannot necessarily classify the data as response or predictor variables.
I essentially have two data sets: anatomical characteristics (a combination of resin duct data and annual growth data) as well as chemical characteristics (a combination of the monoterpene, diterpene and non-structural carbohydrate data).
The following variables are resin duct characteristics:
The following variables were used to represent radial growth:
The following variables are chemical characteristics:
I essentially have two data sets: anatomical characteristics (a combination of resin duct data and annual growth data) as well as chemical characteristics (a combination of the monoterpene, diterpene and non-structural carbohydrate data).
The following variables are resin duct characteristics:
- Resin Duct Production (no. yr-1) - number of resin ducts per 10 mm width in a given year on an increment core or wedge
- Total Resin Duct Area (mm2 yr-1) - sum of resin duct area per 10 mm width in a given year on an increment core or wedge
- Relative Resin Duct Area (% yr-1) - percent area occupied by resin ducts per year within the ring area for a given year on each increment core or wedge
- Resin Duct Size (mm2 yr-1) - mean size of resin ducts per 10 mm width in a given year on an increment core or wedge
- Resin Duct Density (no. mm-2 yr-1) - total number of resin ducts per year divided by the ring area (10 mm * ring width) for a given year
The following variables were used to represent radial growth:
- Ring Width (mm yr-1)
- Basal Area Increment (BAI, mm2 yr-1)
The following variables are chemical characteristics:
- Total Monoterpene Concentration (μg/mg) - sum of all monoterpenes per tree
- Total Diterpene Concentration (μg/mg) - sum of all diterpenes per tree
- Total Non-structural Carbohydrate Concentration (μg/mg) - sum of all non-structural carbohydrates per tree
- Total Terpene Concentration (μg/mg) - the sum of monoterpenes and diterpenes
histograms of the Data
Correlation Plots
To help visualize the data, I created the following correlation plots.
Univariate Correlation Test Results
Chemical Correlations
Total Terpene and Anatomical Characteristic Correlations
Total Non-structural Carbohydrate and Anatomical Characteristic Correlations
- Total Monoterpenes and Total Diterpenes: r = 0.84, p-value < 0.001
- Total Monoterpenes and Total Non-Structural Carbohydrates: r = -0.05, p-value = 0.14
- Total Diterpenes and Total Non-Structural Carbohydrates: r = 0.04 , p-value = 0.27
- Total Terpenes and Total Non-Structural Carbohydrates: r = 0.03, p-value = 0.46
Total Terpene and Anatomical Characteristic Correlations
- Total Terpenes and Resin Duct Production: r = 0.28, p-value < 0.001
- Total Terpenes and Relative Resin Duct Area: r = -0.22, p-value < 0.001
- Total Terpenes and Total Resin Duct Area: r = 0.35, p-value < 0.001
- Total Terpenes and Resin Duct Density: r = -0.32, p-value < 0.001
- Total Terpenes and Resin Duct Size: r = 0.12, p-value = < 0.001
- Total Terpenes and Ring Width: r = 0.56, p-value < 0.001
- Total Terpenes and Basal Area Increment: r = 0.58, p-value < 0.001
Total Non-structural Carbohydrate and Anatomical Characteristic Correlations
- Total Non-structural Carbohydrate and Resin Duct Production: r = 0.07, p-value = 0.05
- Total Non-structural Carbohydrate and Relative Resin Duct Area: r = 0.03, p-value = 0.37
- Total Non-structural Carbohydrate and Total Resin Duct Area: r = 0.13, p-value < 0.001
- Total Non-structural Carbohydrate and Resin Duct Density: r = -0.04, p-value = 0.19
- Total Non-structural Carbohydrate and Resin Duct Size: r = 0.14, p-value < 0.001
- Total Non-structural Carbohydrate and Ring Width: r = 0.18, p-value < 0.001
- Total Non-structural Carbohydrate and Basal Area Increment: r = 0.11, p-value < 0.001
Principle component analysis (PCA) Plots
To further visualize the data, I created various PCA plots of each data set as well as the combined data sets.
Checking for Errors
To check for errors in my data, I looked at the minimum and maximum values of the variables to see if data fell within an expected range. I also had a second and third person look over my data for any inconsistencies or inaccuracies. I also created histograms and pca plots of my data to transform data and remove outliers.
